其实科研数据处理用Origin作图就足够了,但是有一天心血来潮就想试试Matlab,然后发现画的图挺好看的,索性把写的一些Matlab脚本的函数和代码就在这里总结一下吧。
用Matlab画图的坏处是第一遍写脚本很多参数要试,得改很多次,每次改完都要运行看效果,写第一个脚本会麻烦点;但好处是后面作类似的图可以在原来脚本的基础上直接改参数就行了,再往后作图就会省事很多。
常用绘图命令和函数
-
readmatrix('filename');:导入表格数据 -
figure();:创建一个新的图形窗口,用于绘制曲线 -
plot();:绘制曲线,定义曲线的类型,颜色和线宽等 -
hold on;:在窗口中保持当前图形并绘制新图形 -
xlabel(); ylabel();:定义坐标轴的名字及其字体等属性 -
xlim(); ylim();:定义坐标轴的取值范围 -
xticks(); yticks();:定义坐标轴取值和步长(决定了坐标轴实际显示的数值) -
legend();:定义图例内容
折线图示例
plot()函数的详细参数说明可以参考官方文档
以我自己的绘图脚本为例:
plot_line_width = 3;    %定义图形线宽
fontname_all = 'times new roman';    %统一全部字体
xlabel_name = 'Potential (V)';    %定义x轴标签名字
ylabel_name = 'Specific Current (A g^{-1})';    %定义x轴标签名字
axis_linewidth = 2;    %定义坐标轴线宽
axis_fontsize = 28;    %定义坐标轴的标签和坐标字号
xaxis_range = [-0.2,3.8];    %定义x轴坐标范围
yaxis_range = [-0.18,0.25];    %定义y轴坐标范围
xaxis_ticks = 0:1:3.8;    %定义x轴坐标范围和步长
yaxis_ticks = -0.1:0.1:0.25;    %定义y轴坐标范围和步长
legend_fontsize = 22;    %定义图例字号
selected_color = {'#F97F51', '#1B9CFC', '#F8EFBA', '#58B19F', '#2C3A47',...
    '#B33771', '#3B3B98', '#FD7272', '#9AECDB', '#D6A2E8'};    %设置颜色矩阵


CV = readmatrix('data.xlsx');
x26 = CV(:,1);
y26 = CV(:,3);
x28 = CV(:,4);
y28 = CV(:,6);
x30 = CV(:,7);
y30 = CV(:,9);


figure();
plot(x26, y26, 'color', selected_color{1}, 'LineWidth', plot_line_width);
hold on;
plot(x28, y28, 'color', selected_color{2}, 'LineWidth', plot_line_width);
hold on;
plot(x30, y30, 'color', selected_color{4}, 'LineWidth', plot_line_width);


%title('Sinusoidal Function');
xlabel(xlabel_name, 'FontName', fontname_all);
ylabel(ylabel_name, 'FontName', fontname_all);
xlim(xaxis_range);
xticks(xaxis_ticks);
ylim(yaxis_range);
yticks(yaxis_ticks);
%xticklabels({1,2,3,4,5});%自定义x轴坐标标签
%yticklabels({1,2,3,4,5});%自定义y轴坐标标签
l = legend('3.2 V', '3.4 V', '3.6 V');   %定义图例
set(l, 'box', 'off', 'fontname', fontname_all, 'fontsize', legend_fontsize, ...
    'location', 'northwest', 'orientation', 'horizontal', 'NumColumns', 3);   %设置图例的属性
set(gca, 'fontname', fontname_all, 'FontSize', axis_fontsize, ...
    'linewidth', axis_linewidth, 'box','off','Position', [0.175, 0.2, 0.65, 0.7]);    %设置坐标轴(ax)属性
set(gcf, 'position', [50, 50, 850, 700]);    %设置图形(figure)属性

% 下面代码用于实现只显示左轴和下轴的刻度
ax2 = axes('position', get(gca, 'position'), 'xaxislocation', 'top', ...
    'yaxislocation', 'right', 'color', 'none', ...
    'XColor','k','YColor','k');
set(ax2, 'xtick', [], 'ytick', [], 'linewidth', axis_linewidth, 'box','off');
在绘制完图形之后可以通过set()函数修改包括坐标轴,图形等各个对象的属性,其中gca(get current ax)表示获取当前坐标轴,gcf(get current figure)表示获取当前图形
附上常用的颜色表示:
| 颜色名称 | 短名称 | RGB 三元组 | 外观 |
|---|---|---|---|
"red" |
"r" |
[1 0 0] |
 |
"green" |
"g" |
[0 1 0] |
 |
"blue" |
"b" |
[0 0 1] |
 |
"cyan" |
"c" |
[0 1 1] |
 |
"magenta" |
"m" |
[1 0 1] |
 |
"yellow" |
"y" |
[1 1 0] |
 |
"black" |
"k" |
[0 0 0] |
 |
"white" |
"w" |
[1 1 1] |
 |
点(线)图示例
由于plot()函数在默认情况下绘制的是折线图,要绘制点线图只需要在plot()函数中声明样式即可,常用的线性:
| 线型 | 描述 | 表示的线条 |
|---|---|---|
"-" |
实线 |  |
"--" |
虚线 |  |
":" |
点线 |  |
"-." |
点划线 |  |
常用的标记:
| 标记 | 描述 | 生成的标记 |
|---|---|---|
"o" |
圆圈 |  |
"+" |
加号 |  |
"*" |
星号 |  |
"." |
点 |  |
"x" |
叉号 |  |
"_" |
水平线条 |  |
"|" |
垂直线条 |  |
"square" |
方形 |  |
"diamond" |
菱形 |  |
"^" |
上三角 |  |
"v" |
下三角 |  |
">" |
右三角 |  |
"<" |
左三角 |  |
"pentagram" |
五角形 |  |
"hexagram" |
六角形 |  |
"none" |
无标记 | 不适用 |
点线图的标记样式为在点图后加-,例如'o-'。
plot_line_width = 3;    %定义点线图线宽
plot_marker_size = 12;    %定义点线图标记符号尺寸
fontname_all = 'times new roman';    %统一全部字体
xlabel_name = 'Current Density (A g^{-1})';    %定义x轴标签名字
ylabel_name = 'Specific Capacitance (F g^{-1})';    %定义x轴标签名字
axis_linewidth = 2;    %定义坐标轴线宽
axis_fontsize = 28;    %定义坐标轴的标签和坐标字号
xaxis_range = [0,10.5];    %定义x轴坐标范围
yaxis_range = [0,40];    %定义y轴坐标范围
xaxis_ticks = 0:2:10;    %定义x轴刻度和步长
yaxis_ticks = 0:10:40;    %定义y轴坐标范围和步长
legend_fontsize = 22;    %定义图例字号
selected_color = {'#51c4c2', '#0d818c', '#4583b3', '#f78e26', '#f172ad', '#f7afb9', ...
    '#c63596', '#be86ba', '#8b66b8', '#4068b2', '#512a93', '#223271'};    %定义颜色矩阵


%读入数据
data = readmatrix('data.xlsx');
x1 = data(:,1);
y1 = data(:,2);


figure();
plot(x1, y1, 'o-', 'color', selected_color{2}, 'LineWidth', plot_line_width, ...
    'markersize', plot_marker_size);


%title('Sinusoidal Function');
xlabel(xlabel_name, 'FontName', fontname_all);
ylabel(ylabel_name, 'FontName', fontname_all);
xlim(xaxis_range);
xticks(xaxis_ticks);
ylim(yaxis_range);
yticks(yaxis_ticks);
%xticklabels({1,2,3,4,5});%自定义x轴坐标标签
%yticklabels({1,2,3,4,5});%自定义y轴坐标标签
l = legend('');   %定义图例
set(l, 'box', 'off', 'fontname', fontname_all, 'fontsize', legend_fontsize, ...
    'location', 'northeast', 'orientation', 'vertical', 'NumColumns', 1);
set(gca, 'fontname', fontname_all, 'FontSize', axis_fontsize, ...
    'linewidth', axis_linewidth, 'box','off','Position', [0.2, 0.2, 0.7, 0.7]);
set(gcf, 'position', [50, 50, 800, 700]);


ax2 = axes('position', get(gca, 'position'), 'xaxislocation', 'top', ...
    'yaxislocation', 'right', 'color', 'none', ...
    'XColor','k','YColor','k');
set(ax2, 'xtick', [], 'ytick', [], 'linewidth', axis_linewidth, 'box','off');
双y轴点图
主要使用yyaxis指定曲线对应的y轴,例如yyaxis left指定左侧y轴,yyaxis right指定右侧y轴。
plot_line_width = 3;    %定义点线图线宽
plot_marker_size = 12;    %定义点线图标记符号尺寸
% title_name = 'Plan 77-2';    %定义title
fontname_all = 'times new roman';    %统一全部字体
xlabel_name = 'Cycling Number';    %定义x轴标签名字
y_left_label_name = 'Capacitance Retention (%)';    %定义左侧y轴标签名字
y_right_label_name = 'Efficiency (%)';    %定义右侧y轴标签名字
axis_linewidth = 2;    %定义坐标轴线宽
axis_fontsize = 28;    %定义坐标轴的标签和坐标字号
xaxis_range = [0,10000];    %定义x轴坐标范围
y_left_axis_range = [0,200];    %定义左侧y轴坐标范围
y_right_axis_range = [0,120];    %定义右侧y轴坐标范围
xaxis_ticks = 0:2500:10000;    %定义x轴刻度和步长
y_left_axis_ticks = 0:50:200;    %定义左侧y轴坐标范围和步长
y_right_axis_ticks = 0:20:120;    %定义右侧y轴坐标范围和步长
legend_fontsize = 26;    %定义图例字号
selected_color = {'#51c4c2', '#0d818c', '#4583b3', '#f78e26', '#f172ad', '#f7afb9', ...
    '#c63596', '#be86ba', '#8b66b8', '#4068b2', '#512a93', '#223271'};    %定义颜色矩阵


%读入数据
data = readmatrix('data.xlsx');
x1 = data(3:499:end,1);
y1 = data(3:499:end,3);    %left axis
x2 = data(3:499:end,1);
y2 = data(3:499:end,4);    %right axis
x3 = data(3:499:end,5);
y3 = data(3:499:end,7);    %left axis
x4 = data(3:499:end,5);
y4 = data(3:499:end,8);    %right axis

% format bank;  %format bank设置输出格式,使得数值显示为定点格式,且小数点后保留两位数字
% charge_retention = num2str(data1(end,2)/data1(1,2)*100);
% discharge_retention = num2str(data1(end,3)/data1(1,3)*100);
% cyclling_number = num2str(data1(end,1));
% legend1 = ['Charge(retain ', charge_retention, ' \% after ', cyclling_number, ' cycles).'];    %设置图例1
% legend2 = ['Discharge(retain ', discharge_retention, ' \% after ', cyclling_number, ' cycles).'];    %设置图例2

figure();
yyaxis left;
plot(x1, y1, 'o', 'color', selected_color{1}, 'LineWidth', plot_line_width, ...
    'markersize', plot_marker_size);
hold on;
plot(x3, y3, 's', 'color', selected_color{7}, 'LineWidth', plot_line_width, ...
    'markersize', plot_marker_size);
hold on;
yyaxis right;
plot(x2, y2, 'o', 'color', selected_color{1}, 'LineWidth', plot_line_width, ...
    'markersize', plot_marker_size);
hold on;
plot(x4, y4, 's', 'color', selected_color{7}, 'LineWidth', plot_line_width, ...
    'markersize', plot_marker_size);


% title(title_name);    %设置标题
xlabel(xlabel_name, 'FontName', fontname_all);
ylabel(y_right_label_name, 'FontName', fontname_all);
xlim(xaxis_range);
xticks(xaxis_ticks);
ylim(y_right_axis_range);
yticks(y_right_axis_ticks);

yyaxis left;
ylabel(y_left_label_name, 'FontName', fontname_all);
ylim(y_left_axis_range);
yticks(y_left_axis_ticks);

ax = gca;
%ax.YAxis(1).Color = 'k'; % 左侧y轴刻度颜色
%ax.YAxis(2).Color = 'k'; % 右侧y轴刻度颜色

%xticklabels({1,2,3,4,5});%自定义x轴坐标标签
%yticklabels({1,2,3,4,5});%自定义y轴坐标标签
l = legend('2.8 V', '3.0 V');   %定义图例
set(l, 'box', 'off', 'fontname', fontname_all, 'fontsize', legend_fontsize, ...
    'location', 'southwest', 'orientation', 'vertical', 'NumColumns', 1);
set(ax, 'fontname', fontname_all, 'FontSize', axis_fontsize, ...
    'linewidth', axis_linewidth, 'box','off','Position', [0.175, 0.2, 0.65, 0.7]);
set(gcf, 'position', [50, 50, 1400, 700]);


ax2 = axes('position', get(gca, 'position'), 'xaxislocation', 'top', ...
    'yaxislocation', 'right', 'color', 'none', ...
    'XColor','k','YColor','k');
set(ax2, 'xtick', [], 'ytick', [], 'linewidth', axis_linewidth, 'box','off');
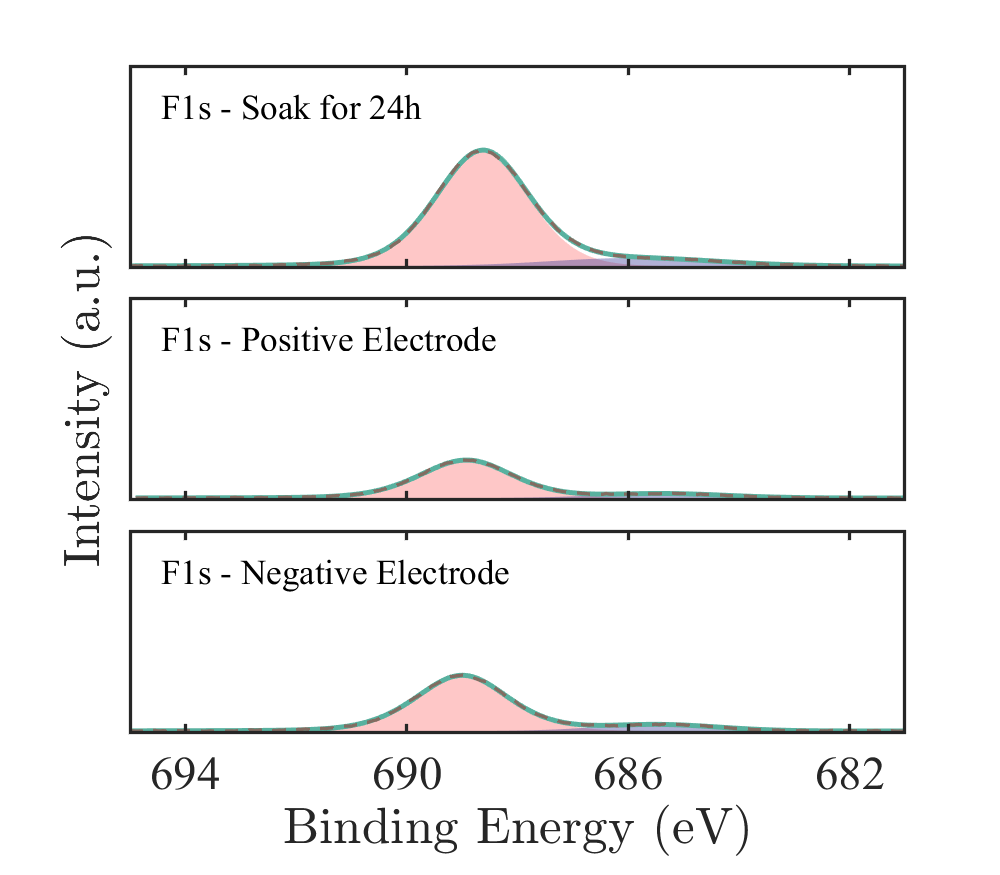
绘制面积(填充)图&&在一个窗口绘制多图
首先要对窗口进行布局,比如我要放几张图,要怎么安排这几张图的位置。假设我要放三张图,这3张图分成1列纵向排布,那么首先需要用到tiledlayout(3,1,'TileSpacing', 'compact')函数安排一个3行1列的布局,后面的'TileSpacing', 'compact'用于表示尽可能减少三张图之间的间距,这样排布会更紧密
布局安排好之后使用nexttile来分别在每个区域绘图就可以了
绘制面积图需要用到area()函数,可以参考官方文档,以我自己用的为例,常用的参数包括:
'facecolor': 表示面积填充的颜色
'facealpha': 设置面积填充颜色的透明度,0表示完全透明,1表示完全不透明
'edgecolor': 表示面积图边缘的颜色,'none'表示没有颜色
'basevalue': 设置面积图的基线值,0表示填充到y轴
'showbaseline': 此参数控制是否显示基线,'off'表示不显示基线
在这个脚本中还用到了text()函数,用于在图中某位置添加文字说明
plot_line_width = 3;    %定义图形线宽
fontname_all = 'times new roman';    %统一全部字体
xlabel_name = 'Binding Energy (eV)';    %定义x轴标签名字
ylabel_name = 'Intensity (a.u.)';    %定义x轴标签名字
axis_linewidth = 2;    %定义坐标轴线宽
axis_fontsize = 28;    %定义坐标轴的标签和坐标字号
xaxis_range = [681,695];    %定义x轴坐标范围
yaxis_range = [-2000,200000];    %定义y轴坐标范围
xaxis_ticks = 682:4:695;    %定义x轴坐标范围和步长
yaxis_ticks = -2000:5000:200000;    %定义y轴坐标范围和步长
legend_fontsize = 24;    %定义图例字号
selected_color = {'#F97F51', '#1B9CFC', '#F8EFBA', '#58B19F', '#2C3A47',...
    '#B33771', '#3B3B98', '#FD7272', '#9AECDB', '#D6A2E8'};    %设置颜色矩阵


xps = readmatrix('4pyt f1s.xlsx');
x1 = xps(:,1);
y1 = xps(:,2);
x2 = xps(:,1);
y2 = xps(:,3);
x3 = xps(:,1);
y3 = xps(:,4);
x4 = xps(:,1);
y4 = xps(:,5);

x5 = xps(:,7);
y5 = xps(:,8);
x6 = xps(:,7);
y6 = xps(:,9);
x7 = xps(:,7);
y7 = xps(:,10);
x8 = xps(:,7);
y8 = xps(:,11);

x9 = xps(:,13);
y9 = xps(:,14);
x10 = xps(:,13);
y10 = xps(:,15);
x11 = xps(:,13);
y11 = xps(:,16);
x12 = xps(:,13);
y12 = xps(:,17);


figure();


tiledlayout(3,1,'TileSpacing', 'compact')

nexttile
area(x2, y2, 'facecolor',selected_color{8},'facealpha',0.4,'edgecolor','none','basevalue', 0,'showbaseline','off');
hold on;
area(x3, y3, 'facecolor',selected_color{7},'facealpha',0.4,'edgecolor','none','basevalue', 0,'showbaseline','off');
hold on;
plot(x4, y4, 'color', selected_color{4}, 'LineWidth', plot_line_width);
hold on;
plot(x1, y1, '--','color', '#826C61', 'LineWidth', 2 );

text('string','F1s - Soak for 24h', 'units', 'normalized', 'position', [0.04,0.8], 'FontSize',21,'fontname', fontname_all);
xlim(xaxis_range);
xticks(xaxis_ticks);
ylim(yaxis_range);
yticks(yaxis_ticks);
%xticklabels({1,2,3,4,5});%自定义x轴坐标标签
%yticklabels({1,2,3,4,5});%自定义y轴坐标标签
%l = legend('0.5 M', '1.0 M', '1.5 M');   %定义图例
%set(l, 'Interpreter','latex', 'box', 'off', 'fontname', fontname_all, 'fontsize', legend_fontsize, ...
%    'location', 'northwest', 'orientation', 'horizontal', 'NumColumns', 3);
set(gca, 'fontname', fontname_all, 'FontSize', axis_fontsize, ...
    'linewidth', axis_linewidth, 'XTickLabel', [],'YTickLabel', [],...
    'XDir','reverse','ytick',[]);
set(gcf, 'position', [50, 50, 800, 700]);

nexttile
area(x6, y6, 'facecolor',selected_color{8},'facealpha',0.4,'edgecolor','none','basevalue', 0,'showbaseline','off');
hold on;
area(x7, y7, 'facecolor',selected_color{7},'facealpha',0.4,'edgecolor','none','basevalue', 0,'showbaseline','off');
hold on;
plot(x8, y8, 'color', selected_color{4}, 'LineWidth', plot_line_width);
hold on;
plot(x5, y5, '--','color', '#826C61', 'LineWidth', 2);

text('string','F1s - Positive Electrode', 'units', 'normalized', 'position', [0.04,0.8], 'FontSize',21,'fontname', fontname_all);
ylabel(ylabel_name, 'Interpreter','latex','FontName', fontname_all);
xlim(xaxis_range);
xticks(xaxis_ticks);
ylim(yaxis_range);
yticks(yaxis_ticks);
%xticklabels({1,2,3,4,5});%自定义x轴坐标标签
%yticklabels({1,2,3,4,5});%自定义y轴坐标标签
%l = legend('0.5 M', '1.0 M', '1.5 M');   %定义图例
%set(l, 'Interpreter','latex', 'box', 'off', 'fontname', fontname_all, 'fontsize', legend_fontsize, ...
%    'location', 'northwest', 'orientation', 'horizontal', 'NumColumns', 3);
set(gca, 'fontname', fontname_all, 'FontSize', axis_fontsize, ...
    'linewidth', axis_linewidth, 'XTickLabel', [],'YTickLabel', [],...
    'XDir','reverse','ytick',[]);
set(gcf, 'position', [50, 50, 800, 700]);


nexttile
area(x10, y10, 'facecolor',selected_color{8},'facealpha',0.4,'edgecolor','none','basevalue', 0,'showbaseline','off');
hold on;
area(x11, y11, 'facecolor',selected_color{7},'facealpha',0.4,'edgecolor','none','basevalue', 0,'showbaseline','off');
hold on;
plot(x12, y12, 'color', selected_color{4}, 'LineWidth', plot_line_width);
hold on;
plot(x9, y9,'--' ,'color', '#826C61', 'LineWidth', 2);


%title('Sinusoidal Function');
xlabel(xlabel_name, 'Interpreter','latex','FontName', fontname_all);
text('string','F1s - Negative Electrode', 'units', 'normalized', 'position', [0.04,0.8], 'FontSize',21,'fontname', fontname_all);
xlim(xaxis_range);
xticks(xaxis_ticks);
ylim(yaxis_range);
yticks(yaxis_ticks);
%xticklabels({1,2,3,4,5});%自定义x轴坐标标签
%yticklabels({1,2,3,4,5});%自定义y轴坐标标签
%l = legend('0.5 M', '1.0 M', '1.5 M');   %定义图例
%set(l, 'Interpreter','latex', 'box', 'off', 'fontname', fontname_all, 'fontsize', legend_fontsize, ...
%    'location', 'northwest', 'orientation', 'horizontal', 'NumColumns', 3);
set(gca, 'fontname', fontname_all, 'FontSize', axis_fontsize, ...
    'linewidth', axis_linewidth, 'YTickLabel', [],'XDir','reverse',...
    'ytick',[]);  %'XDir','reverse'用于将x轴反向
set(gcf, 'position', [50, 50, 800, 700]);
以下是使用该脚本的绘制结果示例:
NCS期刊配色方案
{'#51c4c2', '#0d818c', '#4583b3', '#f78e26', '#f172ad', '#f7afb9', '#c63596', '#be86ba', '#8b66b8', '#4068b2', '#512a93', '#223271'}
{'#b03d26', '#005f81', '#9ccfe6', '#e0897e', '#a5a7ab'}   % 很舒服
{'#f7ae55', '#c4dfa2', '#70c17f', '#f9e9ab', '#b7e1e9', '#7ca9cc'}   % 浅色渐变
{'#8000ff', '#b2f397', '#4d4dfb', '#e5cd75', '#1697f3', '#ff9a51', '#3dd5e9', '#ff4b22', '#81ffb6', '#ff0000'}  % 明亮
{'#be402a', '#a635f6', '#16c41c', '#4b6cff', '#ff2200'}  % 快速分辨,高饱和
{'#69ab32', '#f0e356'}
{'#bcd49b', '#f8efaf'}  % 浅色
{'#7dc5a0', '#d58890'}
{'#1a95d3', '#D31275'}
{'#d28019', '#796Fa4', '#6faede'}
{'#2a7dc1', '#e36d24', '#237b7b'}
{'#f7c496', '#98ce98', '#beb0d1', '#f6f3a3'}
{'#501b86', '#318c9a', '#98ab20', '#de9b12'}  % 深色系
{'#814e92', '#f5bb3d', '#e67b50', '#fdedd2'}
{'#974723', '#5892cb', '#66328f', '#f3ba19'}  % 深色高对比
{'#bedb96', '#fad2aa', '#99c4e9', '#e69594'}  % 浅色系
{'#4c94bd', '#e3ad52', '#eae270', '#85c2e4', '#d29bc4'}
{'#119882', '#395281', '#E8957B', '#9288BB', '#E79E41'}
{'#BB4F4F', '#2A69B3', '#74B38F', '#9B76B2', '#B99523', '#27B5AF'}
{'#DF605E', '#9EBB65', '#63B8B8', '#5579B5', '#F6B56A', '#794B21', '#DCBD9B', '#E8CC32', '#BE752D'}
写在最后
各种类型图会根据自己的情况再进行后续更新